
What's at risk by ignoring the data?
What's at risk by ignoring the data? (If you are passionate about Risk Assessments this could be an opportunity)
More “Insight” on why this post is important
What I am trying to say is, if you are passionate about Risk Assessments (PHA’s, HAZOPs, and LOPAs…) then this is one way to become as good as you can be. Passion drives those of us in the business of Risk Assessments to be on a mission, continuously reinvent, and find new purposes. Owner operators have a passion to stay in business; they need to question the purpose and monies spent on everything. If the purpose of Risk Assessments is not increasing or the value and efficiencies are not getting better, yet other things are that they spend money on, then Risk Assessments are endangered of becoming a checkbox exercise. From that, there is an opportunity for individuals who are passionate about Risk Assessments to change the value and the efficiencies.
Owner operators have rising expectations, tighter budgets, and other focuses. It’s up to us, the likeminded individuals of Risk Assessments, to find new efficiencies and new value. Otherwise owner operators become distracted on higher value and ever increasing higher value activities. An owner might say “Risk Assessments, yes we do them all the time.” They believe Risk Assessments are well known and well purposed, so what’s next?
I was reminded recently that owner operators are interested to find new value in Risk Assessments. The trigger discussion was on the need to find new purpose with Revalidation PHA’s and that someone had successfully tested this idea out using a theme of “dead legs” as one way to do that. The details are confidential on purpose to encourage discussion and sharing. However, I imagine that they were analyzing the threats and impacts of liquids hiding and then freezing, cracking, and what the impacts are to people.
It’s so true, that all of us expect more value and efficiencies. We see it every day as new technologies and economic driven innovation change our expectations. Expectations on Risk Assessments are no different. This post is about analyzing the Risk Assessment Data that owner operators have already paid for. It’s the risk data that was analyzed with an old focus, to create 100’s of Recommendations and that was the measure of proof that it was a good job. This post is a story about using that same risk data to create new understanding and then putting ourselves in a position to create new value and new efficiencies. This new understanding can help us come better prepared at the next PHA, with a more precise focus on what’s important. It can help us reduce the cost of Audits and PHA’s and add new value and new efficiencies to keep Risk Assessments out of the ‘Checkbox Penalty Box’. This will help us, and those around us, keep the learning, new and interesting.
Why send this post now?
Process Safety is in position to undergo a significant, permanent, change. Big data analytics, incidents like Macondo and new technology are the enablers for this change. ACM Facility Safety is focused on developing a Predictability Model using big data analytics and learnings from previous industry incidents like Macondo and drawing on 1000's of PHA data sets and field audits.
Too often we find non-believers unwilling to understand how they can make a difference in a PHA session. There are growing signs of employees from the frontlines to executives who do not believe that they can play an important role in making Process Safety matter. Perhaps they served on many PHA teams but continue to see little to no changes as recommended. You might also hear something like this “since there are two of the original PHA session members on site we will entrust them to guide us and keep us safe because they are bright intelligent people”.
More recently we have heard from those who are surprised to learn that PHA’s hold more critical data and more deep learning’s wrt change culture, human behavior and attitudes. These are beyond just looking for “recommendations” from a PHA. These learning’s developed with Analytics bring forward learnings and enable timely understanding of the younger frontline staff by sharing the experience of the baby boomers. If the young understand then a new excitement and attitude will emerge. It will not include “thou shall do”, but rather “hey this makes sense”. Giving the young the tools to learn in a few minutes what took us years is part the bridge and the solution to Process Safety. It better be quick and painless.
Interestingly, we have found others who are again surprised to find that Big Data comparisons provide a new appreciation and understanding when it comes to Process Risks. So taking 1000’s of data sets from PHA’s, LOPA’s, and QRA’s and using a Big Data approach combining data sets from historical safety incidents, audits, and the reliability world we see a NEW Big picture and are exposed to learnings not realized before.
Can Analytics help? Yes, it might take time to recognize trends and apply new learning’s. There are scientists, PHD’s and experts in our world today that can help with that. How can the rest of us play a role in Analytics? Those of us (risk insurers, risk consultants, risk companies) who see the practical side of things because we are inside the business and familiar with applying traditional solutions to traditional risk issues can recognize patterns quickly if portrayed visually.
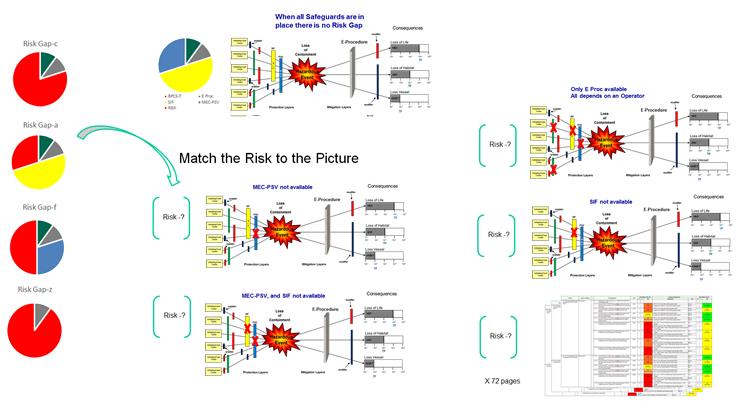
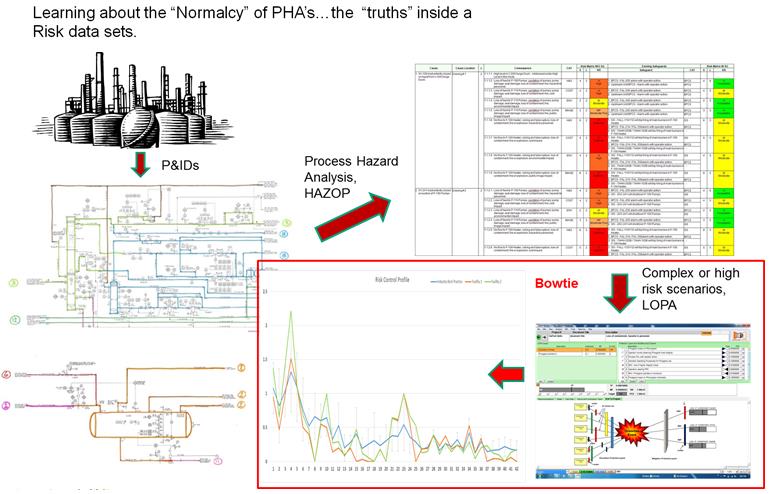
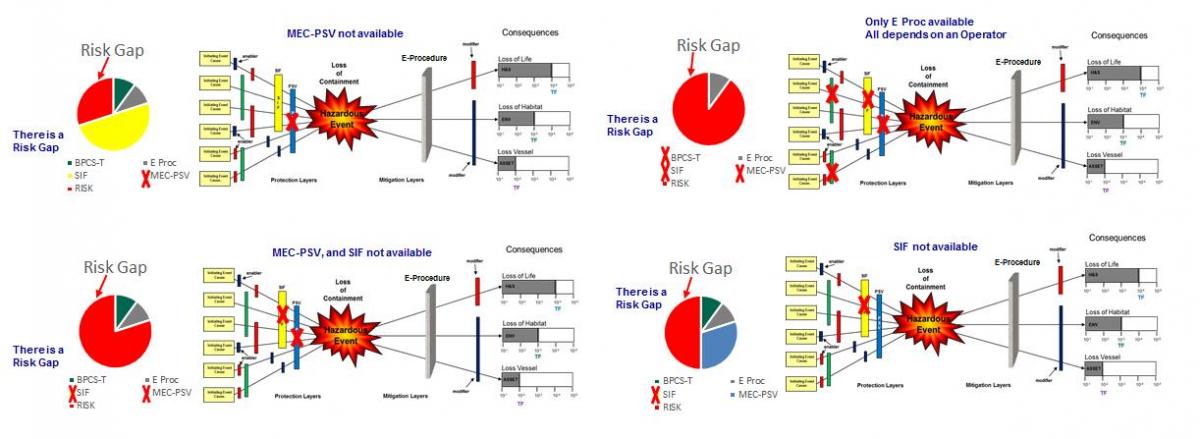
For example, what sticks out for you in the above visuals represented by threats on the left, and impacts on the right? The bowtie center represents a number of scenarios from loss of control, uncontrolled release to exceedance of design. The vertical blocks represent safeguards that range from mechanical, personnel procedures, inspection, personnel training, instrumentation, new technology, inherent design along with external enablers and modifiers.
These visuals can give us a clue that something is up. Something is different. We may not all agree on the interpretation as long as we can agree that closer examination is required and perhaps even urgent.
The bowtie represents a way to visualize something wrong, out of place or just normal. The important thing here is that it is recognizable by a non-expert within a few minutes versus lost in the daily grind or after an unsafe day. Visualizing this on an Excel version of a PHA is virtually impossible with 72 pages of data on one screen. There is no way for the two members of the PHA team to remember and understand this today let alone 5 years from today.
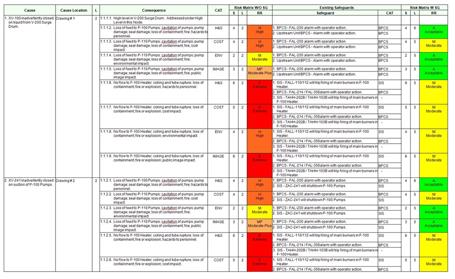
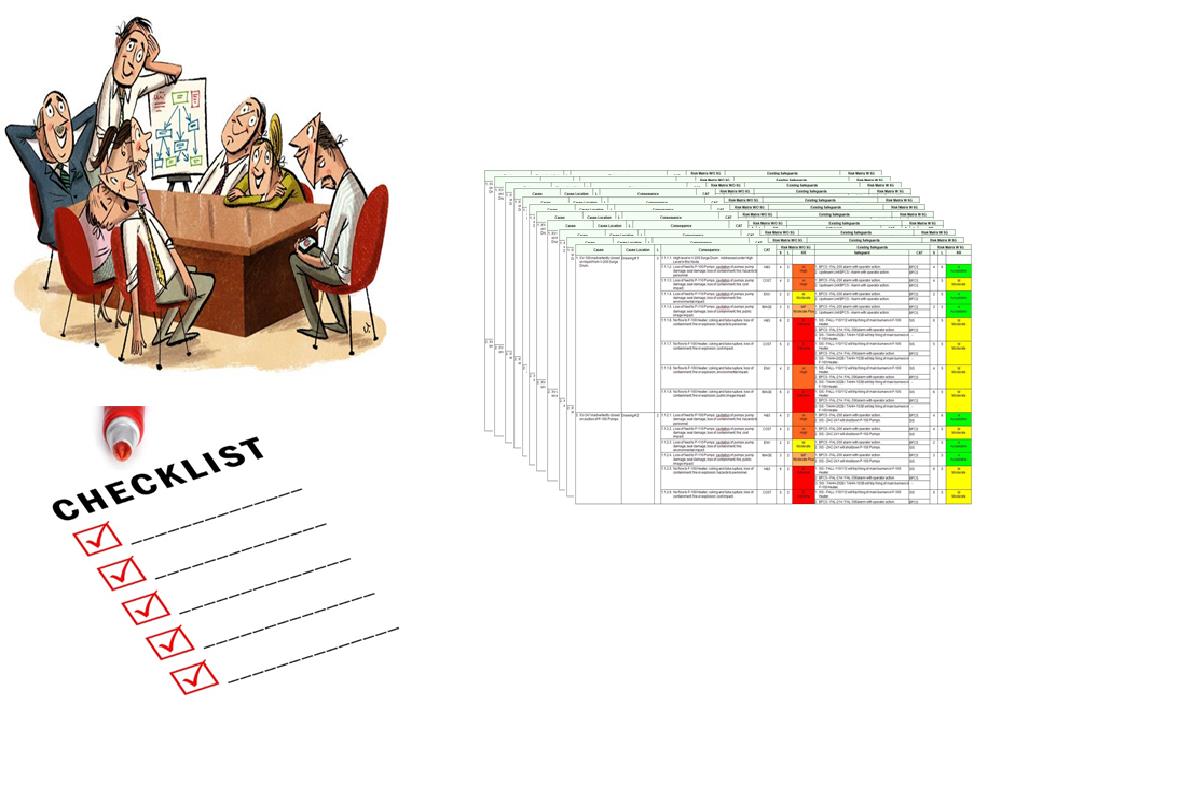
What can be distilled if we have more than one page of data and how quick can we assess what is critical? Above is a single page of data taken from a common PHA tool.
It is estimated that a simple bowtie represents 72 equivalent pages of PHA information.
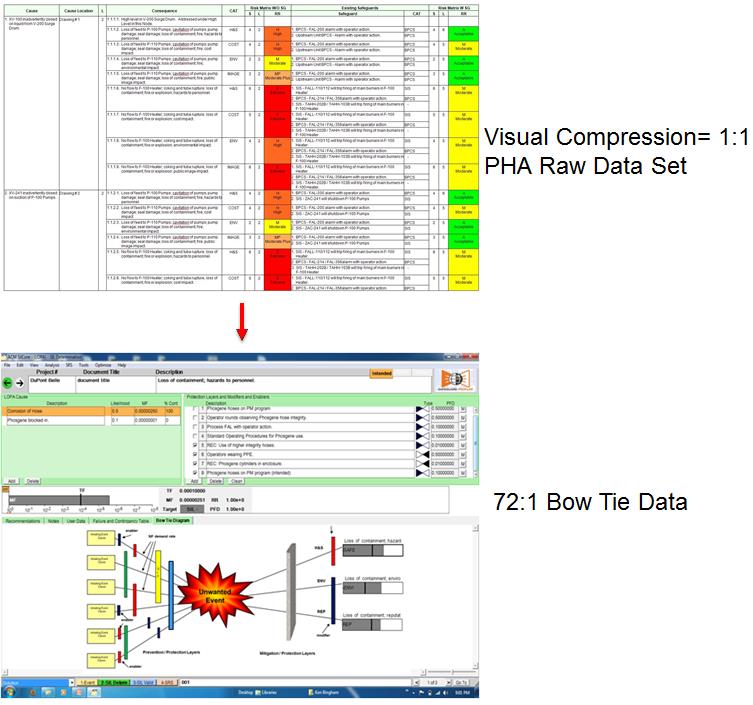
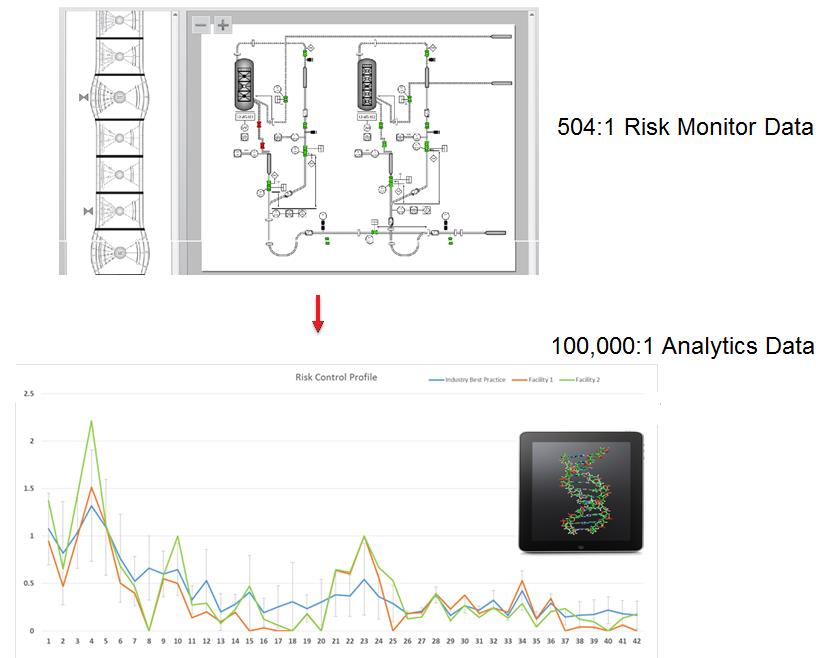
It is estimated that a simple real time process flow diagram can have 504 pages of PHA information. Finally it is estimated that one Profile page of analytics represents 100,000 pages of PHA information.
Background
Eighteen months ago we began the Risk Alive project and started challenging the “checkbox” exercises that have become the norm for PHAs, HAZOPs, LOPAs, SIL studies. We now understand that the data in the “checkbox” exercises really represents truths of hazardous scenarios and processes from field engineering, operations and designers. It is now understood that when the “checkbox data” is shared, integrated and analyzed the resulting clarity can be powerful, insightful, efficient and safer.
By 2008 we had already learned and put into practice the art of making PHA’s come alive using animated bowtie’s that changed in size and color in real time wrt the risk profile. Today, eight years later we are finally realizing it is the “heart” of the PHA that is really important. The heart of the PHA can be made up of the bowties representing all the hazardous events. Converting this data into analytics and examining the trends and relationships is where the gold is hidden.
The work process for a PHA involves accurate information about the plant and its systems. An approved procedure and risk tools are used and PHA team members familiar with the process, and the hazards of the chemicals, and the practices of operations & maintenance. The study includes personnel such as rotating equipment specialists, HSE technical personal, process engineers, operations, instrumentation engineers and leadership. The idea is to identify the hazards and the potential for harm to people, environment, reputation and assets. Then the team makes recommendations to resolve unmitigated risk. The unfortunate part is about solely making recommendations, and soon Recommendations becomes the sole purpose of the PHA. So by the end how you got to making a recommendation or how not making a recommendation becomes unimportant. The measure of success is often about completing the PHA early with as few recommendations as possible.
However what we learned when we converted the PHA data into analytics is that these learnings become powerful tools to predict unsafe days.
Going Forward
There are virtually hundreds of risk assessments conducted every day around the globe. This translates into thousands of recommendations developed from these risk assessments. Everyday new recommendations join the ranks of recommendations that have not been complete from past risk assessments. The resultant here is that every day the total industry risk continues to climb.
This fact is difficult to argue with in North America and it is imperative that a deeper understanding of this issue be brought to the forefront now. It is our responsibility to make it easier for young professionals who are replacing ourselves to garnish this knowledge and continue to make the world a safer place without us. So what can we do for the young Gen X, Y and Z to help them benefit from our learnings and not force them to learn from trial and error?
At a recent Engineering conference held in Calgary, AB. we shared the thought of bridging the learning gap between baby boomers generation and the young. The young are the ones who are in position to carry our experiences and learning’s forward. However they learn in a different way and move forward so fast that its scary thinking about the young never looking back in time to learn as we had to. Analytics can provide a check to ensure that the learning’s of the past are not forgotten. As an older generation we can provide them with an “Experienced Learning Button” enabling them to move forward quickly with confidence.
This makes analyzing old PHA data sets valuable, when these data sets can be analyzed quickly to see clearly ” the heart of the PHA”. This is in addition to understanding “which recommendations matter the most”. It’s not that this analysis couldn’t have been done before. It’s more about doing the analysis on a specific data set and on similar data sets (10’s, 100’s, and 1000’s) and doing it in minutes versus days/weeks. We believe this approach meets the expectations and normalcy of the younger generations. We also believe this can enable a continuous improvement between PHA’s, between changes, between new facilities. And for the likeminded people i.e. Insurers, Risk Consultants, Risk Companies, this approach gives substance to statement; “knowing the value of PHA’s (past PHA’s) is far more than just creating recommendations”
What example learnings can be discovered in a few minutes from a PHA risk data set?
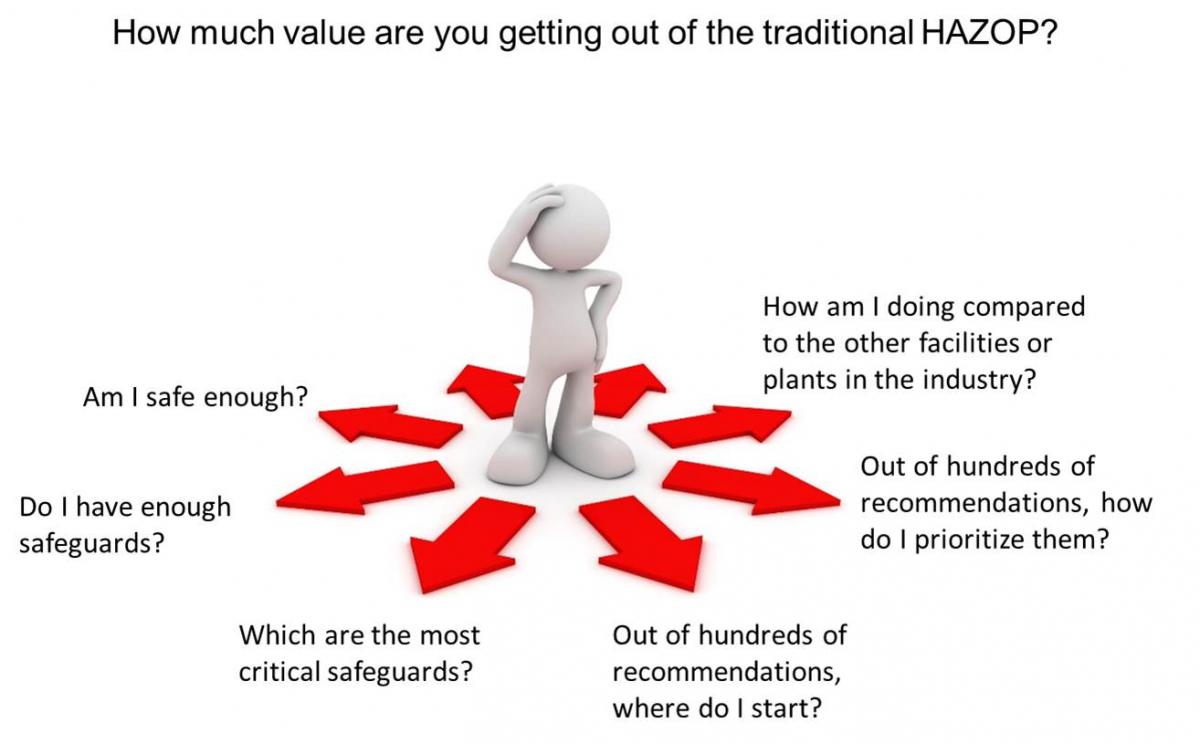
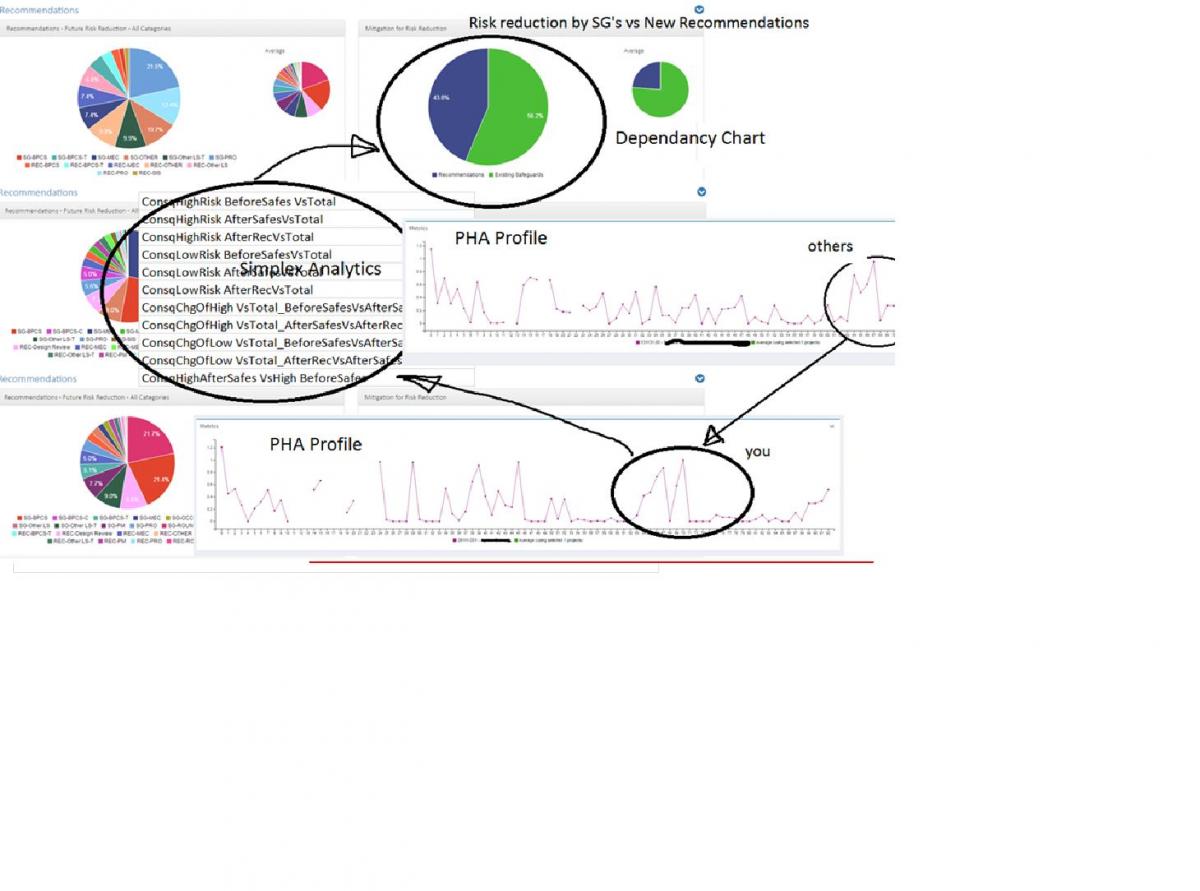
- What are the most critical safeguards, causes, and recommendations? Learning this helps guide the frontlines on conducting audits, planning maintenance and developing training and turnaround budgets. And learning this can hold new insights for executives and managers enabling wiser choice of spending.
- What are the facility dependencies (characteristics of risk reduction, threats and impacts) which describes a facility? I.e. learning where risk reduction comes, what % is by-passable, how does it compare to others (other facilities)? wrt technology, mechanical, human, inherent.
- Are critical causes and threats considered when comparing and understanding what other plant consider and use? Learning’s about the critical causes and threats from other facilities.
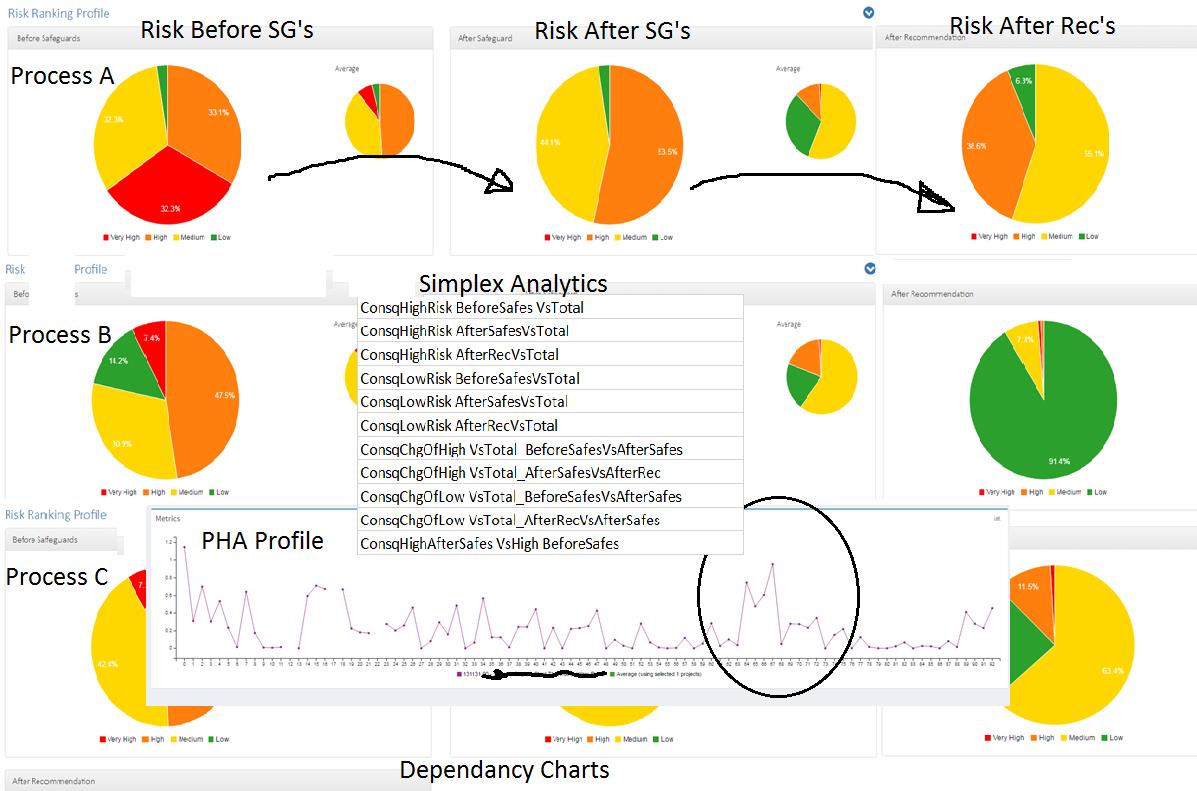
- What are the strengths and weakness of the Risk Profile using science and analytics? Observing these trends on a profile line makes learning easy.
Especially For Insurer’s, Risk Consultants and Risk Companies
Insurers, Risk Consultants and Risk Companies can understand the value of converting PHA data into analytics. And can appreciate a new perspective of what PHA data really holds. It’s because this group understands certain things being on the inside of the business of PHA’s every day. They share the frustration of seeing their hard work to clearly understand the "heart" of the PHA, then to be ignored and forgotten, to get at the recommendations. They share in the frustration of uncompleted recommendations and the normalcy associated with PHA work. They share the concerns of bridging the experience and knowledge of the older generation to the younger generations. They also realize that all of this, has a toll on the culture of people and the reputation of industries.
ACM believes the Insurer’s, Risk Consultants and Risk Companies are entrusted advisors and can help others and their clients to see the benefits of increased learnings using analytics. And based on that, have developed a simple program of work steps called the Risk Cube Partner Program to make it easy to test ACM’s claim “to learn in minutes a new understanding of PHA’s not seen before.” This simple program makes it easy for this group to discuss with their clients directly, the interest and potential benefits of Analytics. This will make it possible for this likeminded group to change the value of PHA's forever.
We whole heartedly encourage this group to learn more about ACM’s claim of extracting deeper learnings of PHA’s in minutes using analytics. If convinced, then with this new understanding, this group can bridge the experience of the past with the future, using the older generations working with younger generations.
This message is not sales initiative but a way to share the benefits of deeper learning’s from existing PHA data sets.
What can we say about Process Safety incidents?
- They occur somewhere all the time.
- They are normally significant.
- Certain groups are always surprised. (executives, communities, regulators)
- It costs a lot to recover and move forward. When an incident repeats itself the consequences are exponential in the eyes of the stakeholders.
- Nothing can be kept secret for long. If owners don’t come clean and share the details someone create a story and share it loudly.
- Recovery time from an incident is growing as industry must work within the social media norms and the share the incident information in almost real time to protect their reputation.
Ken
Answers:
Want to read more ACM articles?